ΑΡΝΗΤΙΚΟΣ ΠΛΗΘΩΡΙΣΜΟΣ ΣΤΗΝ ΕΛΛΑΔΑ: ΚΑΤΑΡΑ Ή ΘΕΡΑΠΕΙΑ;

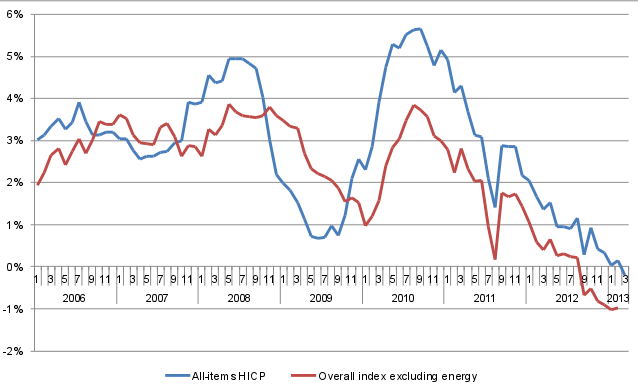
Although it is true that the Greek inflation rate turned negative last month, the growth rate of a core index excluding energy has been negative since last September. This can be considered the first sign that the imposed policy of rebalancing and internal devaluation finally bears fruit. This effect would have been achieved much earlier (and without such social pain) if tax rates had not been raised so aggressively in the past couple of years. In fact, a substantial part of energy-related-inflation can be attributed to increased taxes on electricity bills and heating oil.
Figure 1. HICP and index excluding energy costs, y-o-y change.

Source: Eurostat (prc_hicp_midx database).
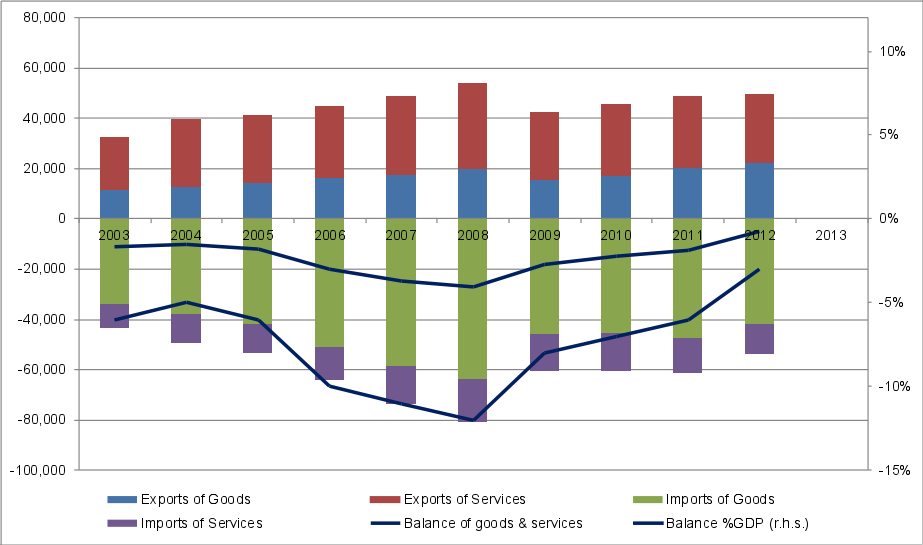
The devaluation will favor the (small, slowly expanding) export oriented sectors (Figure 2) and will somewhat restore the competitiveness of the Greek economy as a whole.
Still, this effect (along with the current dearth of bank credit) comes at a huge cost to the non-tradable sector (which prior to the crisis corresponded to roughly 70% of the economy), since it constitutes unprofitable (and/or riskier) most investment opportunities there. Hence, the extreme current social pain will not cease; at least not until the rebalancing towards the tradable sector (which is a very slow process) matures.
What remains to be seen, however, is whether the implementation of structural changes -currently under way- will succeed in ending this vicious deflationary spiral, or further measures would be necessary to restore confidence in the Greek economy, most effective of which would be the (still rejected by the ECB and the Northern European countries) OSI. I am afraid that the current (even slightly) deflationary environment will not reverse until a selective demand boost takes place; one that will most likely originate from infrastructure development financed by EU structural funds and/or FDI on Greek export oriented business.
Figure 2. Trade of Goods and Services balance.

Source: Bank of Greece.
* Κάθε κείμενο που δημοσιεύεται στο InDeep Analysis εκφράζει και βαραίνει αποκλειστικά τον συντάκτη του. Οι αναλύσεις που δημοσιεύονται δεν συνιστούν συμβουλές για οποιουδήποτε είδους δραστηριότητα. Το InDeep Analysis δεν δεσμεύεται από τις πληροφορίες, τις απόψεις και τις αναλύσεις που δημοσιεύονται στην ψηφιακή πλατφόρμα του, και δεν φέρει απολύτως καμία ευθύνη για αυτές.


